Overview
The Product Promotions Summary offers a platform for viewing summary information of Product Promotions and their usage - including Products, Sizes, Sales, Discount Amounts, and Costs - over a defined period of time.
The reporting options for this report allow for analysing specific Venues & Stores as well as specific Product Promotions.
This can provide a snapshot insight of how a Promotion/s is performing - which Products and/or Sizes are popular or unpopular, how the Promotion is affecting the Nett, and the ability to quickly compare to Cost Total.
Prerequisites
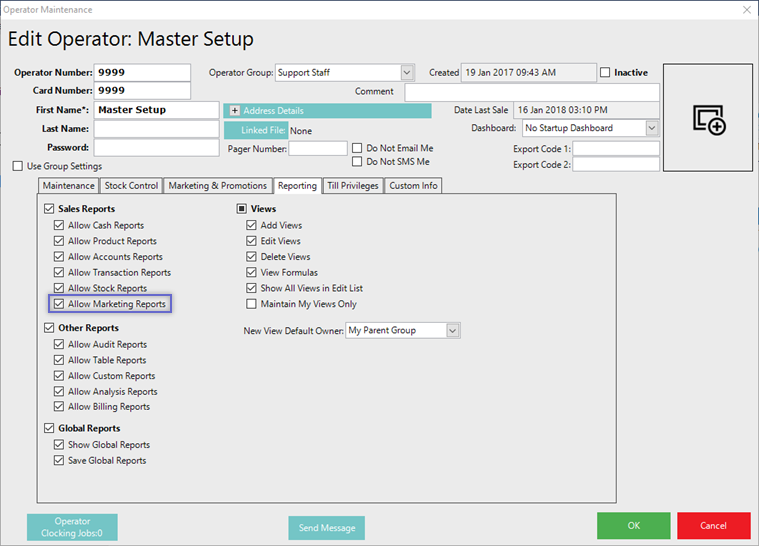
- For an Operator to have access to Marketing Reports, including the Product Promotion Summary, they must have the Allow Marketing Reports flag enabled
- This flag can be found within Operator Maintenance on the Reporting tab and within the Sales Reports section
- If this flag is not enabled, the Operator will not have the ability to access the Product Promotion Summary
Accessing the Report
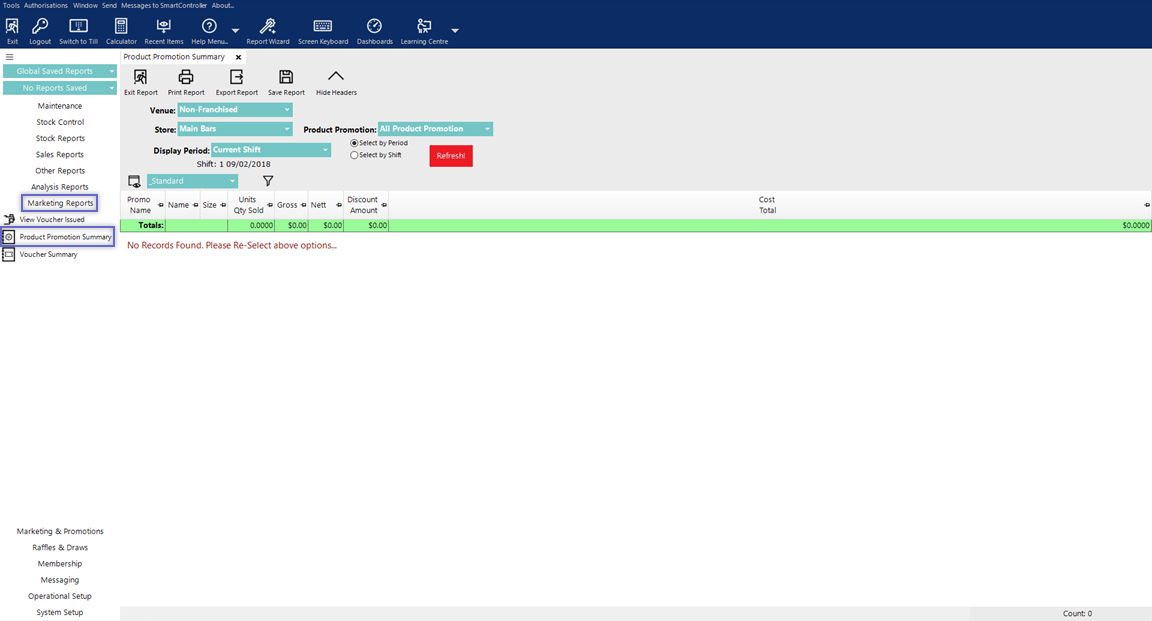
- To locate the Product Promotions Summary, after logging into BackOffice, navigate to the side menu where Marketing Reports can be found (assuming that the logged-in Operator has the above-mentioned flag enabled)
- After expanding the Marketing Reports menu, the Product Promotion Summary will be available for selection
- Select the desired Reporting Options (see below for details) and then click the Display/Refresh button to run the Report
Report Options
Option |
Description |
Visual (if applicable) |
| Venue drop-down |
|
|
| Store drop-down |
|
|
| Product Promotion drop-down |
|
|
| Select by Period & Display Period |
|
|
| Select by Shift |
|
|


"_Standard" View
- The Standard View of the Product Promotion Summary Report consists of the following data columns by default:

Product Promo Usage
- Double-clicking on a line of data within the Report will open a new tab displaying Product Promo Usage for the same period as the Product Promotion Summary for the selected Product Promotion
- This allows for seeing additional data relating to the usage of the Promo including which Venues and Tills were used
- This data can optionally be sorted & analyzed to determine how the Promotion is performing at particular Venues and Tills
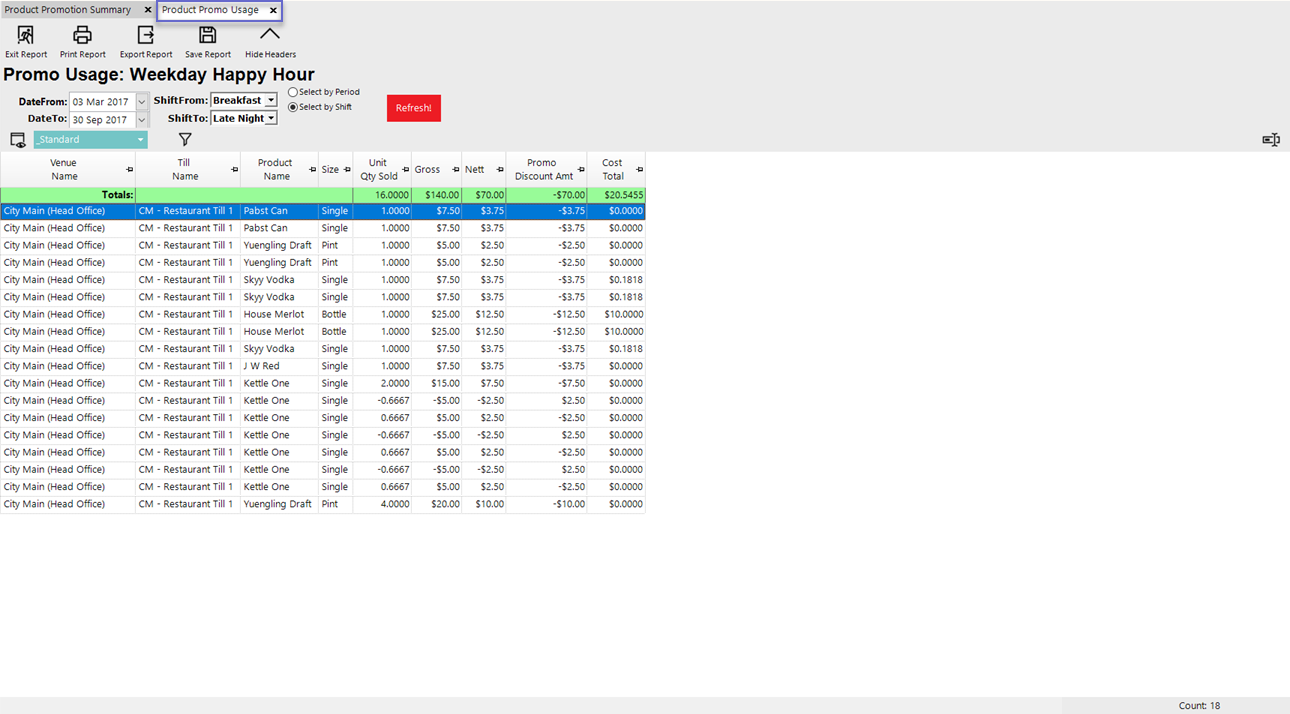
- Once the Product Promo Usage tab is open, if desired, the Reporting Period can be adjusted and the Report can be Refreshed
Best Practices
-
Use Promotion Groups to group related campaigns (e.g., “Summer 2024 Promos”).
-
Run the report at the end of the campaign to evaluate final results.
-
Filter by site or store group to understand regional effectiveness.
-
Combine with sales reports to measure sales uplift versus baseline performance.